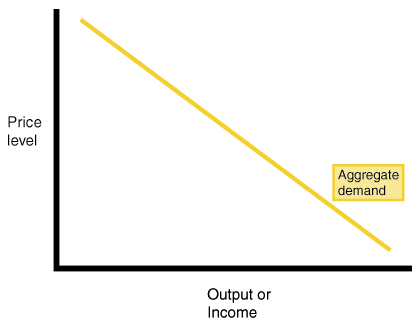
Shows the amount of Real GDP that the private, public, and foreign sector collectively desire to purchase
The relationship between the price level and the level of Real GDP is inverse
Aggregate Demand Curve
Three Reasons AD is downward sloping
Real-Balances Effect:
When the price level is high, households and businesses cannot afford to purchase as much output
When the price level is low, households and businesses can afford to purchase more output
Interest-Rate Effect:
A higher price level increases the interest rate which tends to discourage investment
A lower price level decreases the interest rate which tends to encourage investment
Foreign Purchases Effect
A higher price level increases the demand for relatively cheaper imports
A lower price level increases the foreign demand for relatively cheaper U.S. exports
Shifts in Aggregate Demand (AD)
There are two parts to a shift in AD:
A change in C, Ig, G, and/or Xn
A multiplier effect that produces a greater change than the original change in the 4 components
Increases in AD = AD →
Decreases in AD = AD ←
Consumption
Household spending is affected by:
Consumer wealth
More wealth = more spending (AD shifts →)
Less wealth = less spending (AD shifts ←)
Consumer expectations
Positive expectations = more spending (AD shifts →)
Negative expectations = less spending (AD shifts ←)
Household Indebtedness
Less debt = more spending (AD shifts →)
More debt = less spending (AD shifts ←)
Taxes
Less taxes = more spending (AD shifts →)
More taxes = less spending (AD shifts ←)
Gross Private Investment
Investment spending is sensitive to:
The Real Interest Rate
Lower Real Interest Rate = more investment (AD →)
Higher Real Interest Rate = less investment (AD ←)
Expected Returns
Higher Expected Returns = more investment (AD →)
Lower Expected Returns = less investment (AD ←)
Expected Returns are influenced by
Expectations of future profitability
Technology
Degree of Excess Capacity (Existing Stock of Capital)
Business Taxes
Government Spending
More government spending (AD →)
Less government spending (AD ←)
Net Exports
Net Exports are sensitive to:
Exchange Rates (International value of $)
Strong $ = more imports and fewer exports (AD ←)
Weak $ = fewer imports and more exports (AD →)
Relative Income
Strong Foreign Economies = more exports (AD →)
Weak Foreign Economies = less exports (AD ←)
Aggregate Supply
The level of Real GDP (GDPR) that firms will produce at each Price Level (PL)
Long-Run v. Short-Run
Long-Run
Period of time where input prices are completely flexible and adjust to changes in the price level
In the long-run, the level of Real GDP supplied is independent of the price level
Short-Run
Period of time where input prices are sticky and do not adjust to changes in the price level
In the short-run, the level of Real GDP supplied is directly related to the price level
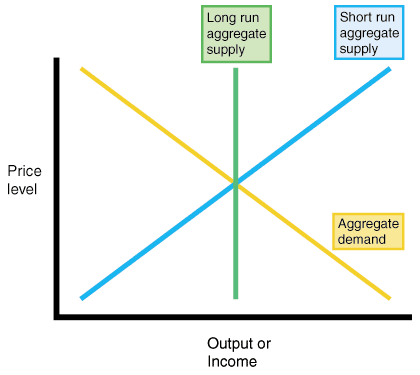
The Long-Run Aggregate Supply (LRAS)
The Long-Run Aggregate Supply or LRAS marks the level of full employment in the economy (analogous to PPC)
LRAS is vertical at the economy's level of full employment
Changes in SRAS
An increase in SRAS is seen as a shift to the right. SRAS →
A decrease in SRAS is seen as a shift to the left. SRAS ←
The key to understanding shifts in SRAS is per unit cost of production
Per-unit production cost = total inpurt cost / total output
Determinants of SRAS (all of the following affect unit production cost)
Input Prices
Productivity
Legal-Institutional Environment
Input Prices
Increases in Resource Prices = SRAS ←
Decreases in Resource Prices = SRAS →
Productivity
Productivity = total output / total inputs
More productivity = lower unit production cost = SRAS →
Lower productivity = higher unit production cost = SRAS ←
Legal-Institutional Environment
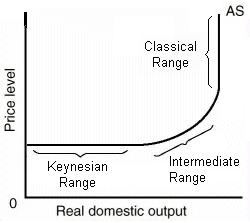
Ranges/Shapes/Views of A.S.
The followers of the Keynesian view believe in a horizontal AS curve, because when the economy is below full employment, AD shifts outward.
Whenever that happens, increase in Real GDP
Employment drops, but price level is constant
That means that demand creates its own supply
Classical Range (Vertical)
In the long run, the AS curve is vertical, because the only effects of an increase in AD is when we're already at full employment
Thus, you have an increase in the price level, and supply creates its own demand (Say's Law)
Intermediate Range
AS is between the Classical and the Keynesian range
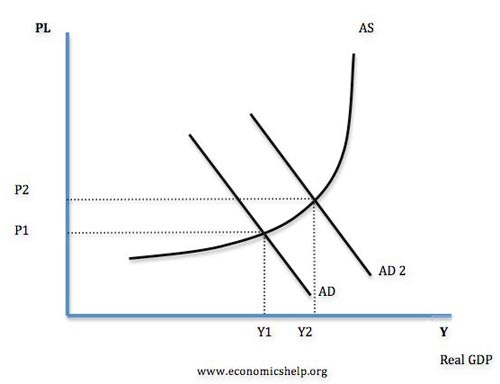
When this occurs, as AS shifts outward, price level and Real GDP increases
CLASSICAL vs. KEYNESIAN DEBATE
The AS/AD Model
The equilibrium of AS and AD determines current output (GDPR) and the price level (PL)
Full Employment
Full Employment Equilibrium exists where AD intersects SRAS and LRAS at the same point
Recessionary Gap
A recessionary gap exists when equilibrium occurs below full employment output
Inflationary Gap
An inflationary gap exists when equilibrium occurs beyond full employment output
Changes (Δ) in AD
Δ Consumption (C)
C up, AD right, GDPR up, PL up, u% down, π% up
C down, AD left, GDPR down, PL down, u% up, π% down
Δ Gross Private Investment (Ig)
Ig up, AD right, GDPR up, PL up, u% down, π% up
Ig down, AD left, GDPR down, PL down, u% up, π% down
Δ Government Spending (G)
G up, AD right, GDPR up, PL up, u% down, π% up
G down, AD left, GDPR down, PL down, u% up, π% down
Δ Net Exports (Xn)
Xn up, AD right, GDPR up, PL up, u% down, π% up
Xn down, AD left, GDPR down, PL down, u% up, π% down
Increase in AD
Decrease in AD
Changes (Δ) in SRAS
Δ Input Prices
Input Prices down, SRAS right, GDPR up & PL down, u% down & π% down
Input Pries up, SRAS left, GDPR down & PL up, u% up & π% up
Δ Productivity
Productivity up, SRAS right, GDPR up & PL down, u% down & π% down
Productivity down, SRAS left, GDPR down & PL up, u% up & π% up
Δ Legal-Institutional Environment
Deregulation, SRAS right, GDPR up & PL down, u% down & π% down
Regulation, SRAS left, GDPR down & PL up, u% up & π% up
Increase in SRAS
Decrease in SRAS
Long-Run Aggregate Supply
Measuring potential output
We're assessing if all our resources are used efficiently
Shifts in LRAS
Technology
Economic Growth
Capital
Entrepreneurship
More resources available
What is investment?
Money spent or expenditures on:
New plants (factories)
Capital equipment (machinery)
Technology (hardware & software)
New homes
Inventories (goods sold by producers)
Expected Rates of Return
How does business make investment decisions?
Cost/Benefit Analysis
How does business determine the benefits?
Expected rate of return
How does business count the cost?
Interest costs
How does business determine the amount of investment they under take?
Compare expected rate of return to interest cost
If expected return > interest cost, then invest
If expected return < interest cost, then do not invest
Real (r%) v. Nominal (i%)
What's the difference?
Nominal is the observable rate of interest. Real subtracts out inflation (π%) and is only known ex post facto
How do you compute the real interest rate (r%)?
r% = i% - π%
What then, determines the cost of an investment decision?
The real interest rate (r%)
Investment Demand Curve (ID)
What is the shape of the Investment Demand Curve?
Downward sloping
Why?
When interest rates are high, fewer investments are profitable; when interest rates are low, more investments are profitable
Conversely, there are few investments that yield high rates of return, and many that yield low rates of return.
The Investment Demand Curve
Changes in r% cause changes in Ig. Factors other than r% may shift the entire ID curve.
Shifts in Investment Demand (ID)
Cost of Production
Business Taxes
Technological Change
Stock of Capital
Expectations
Consumption & Saving / Disposable Income (DI)
Income after taxes or net income
2 Choices
With disposable income, households can either
Consume (spend money on goods and services)
Save (not spend money on goods and services)
Consumption
Household spending
The ability to consume is constrained by
The amount of disposable income
The propensity to save
Do households consume if DI = 0?
Autonomous consumption
Dissaving
Saving
Household NOT spending
The ability to save is constrained by
The amount of disposable income
The propensity to consume
Do households save if DI = 0?
No
APC & APS
APS = average propensity to save
APC = average propensity to consume
APC + APS = 1
1 - APC = APCS
1 - APS = APC
APC > 1 : Dissaving
-APS : Dissaving
MPC & MPS
Marginal propensity to consume
Δ in C / Δ in DI
% of every extra dollar earned that is spent
Marginal propensity to save
Δ in S / Δ in DI
% of every dollar earned that is saved
MPC + MPS = 1
1 - MPC = MPS
1 - MPS = MPC
Determinants of C & S
Wealth
Expectations
Household Debt
Taxes
MPC
The fraction of any change in DI that is consumed
MPS
The fraction of any change in DI that is saved
The Spending Multiplier Effect
An initial change in spending (C, Ig, G, Xn) causes a larger change in aggregate spending, or Aggregate Demand (AD)
Multiplier = Δ in AD / Δ in Spending
Why does this happen?
Expenditures and income flow continuously which sets off a spending increase in the economy.
Calculating the Spending Multiplier
The spending multiplier can be calculated from the MPC or the MPS.
Multiplier = 1/1-MPC or 1/MPS
Multipliers are (+) when there is an increase in spending and (-) when there is a decrease
Calculating the Tax Multiplier
When the government taxes, the multiplier works in reverse
Why?
Because now money is leaving the circular flow
Tax Multiplier (note: it's negative)
= -MPC/1-MPC or -MPC/MPS
If there is a tax-CUT, then the multiplier is (+), because there is now more money in the circular flow
MPS, MPC, & Multipliers
Step 1: Calculate the MPC and MPS
Step 2: Determine which multiplier to use, and whether it's (+) or (-)
Step 3: Calculate the spending and/or tax multiplier
Step 4: Calculate the change in AD
For a better understanding of calculating the MPC, MPS, and the multiplier, I recommend you to watch this video:
Fiscal Policy
Expansionary and Contractionary policy
Deficits and Surpluses
Built-in Stability
Changes in the expenditures or tax revenues of the federal government
2 tools of fiscal policy:
Taxes - government can increase or decrease taxes
Spending - government can increase or decrease spending
Fiscal policy is enacted to promote our nation's economic goals: full employment, price stability, economic growth
Deficits, Surpluses, and Debt
Balanced Budget
Revenues = Expenditures
Budget Deficit
Revenues < Expenditures
Budget Surplus
Revenues > Expenditures
Government Debt
Sum of all deficits - Sum of all surpluses
Government must borrow money when it runs a budget deficit
Government borrows from
Individuals
Corporations
Financial institutions
Foreign entities or foreign governments
Fiscal Policy Two Options
Discretionary Fiscal Policy (action)
Expansionary fiscal policy - think deficit (when in a recession)
Contractionary fiscal policy - think surplus (going through an inflationary period)
Non-Discretionary Fiscal Policy (no action)
Discretionary v. Automatic Fiscal Policies
Discretionary
Increasing or Decreasing Government Spending and/or Taxes in order to return the economy to full employment. Discretionary policy involves policy makers doing fiscal policy in response to an economic problem.
Automatic
Unemployment compensation and marginal tax rates are examples of automatic policies that help mitigate the effects of recession and inflation. Automatic fiscal policy takes place without policy makers having to respond to current economic problems.
Contractionary v. Expansionary Fiscal Policy
Contractionary fiscal policy - policy designed to decrease aggregate demand
Strategy for controlling inflation
Expansionary fiscal policy - policy designed to increase aggregate demand
Strategy for increasing GDP, combatting a recession, and reducing unemployment
Expansionary Fiscal Policy
Recession is countered with expansionary policy
Increase government spending
Decrease taxes
If recession, then increased government spending, and AD shifts right
Contractionary Fiscal Policy
Inflation is countered with contractionary policy
Decrease government spending
Increase taxes
Progressive Tax System
Average tax rate (tax - revenue/GDP) rises with GDP
Proportional Tax System
Average tax rate remains constant as GDP changes
Regressive Tax System
Average tax rate falls with GDP
The more progressive the tax system, the greater the economy's built-in stability.
Hey Michelle! I have to say... your blog is very well organized! I can clearly find what I want to find in this post! I do want to add some information that you can put into it.
Disposable income is income after taxes or net income. The formula: Gross income - Taxes = Disposable income. With DI, households can either consume or save.
Hi Michelle! Great job on your blog so far, it is very organized and easy to follow along! I would just like to add on to why long run aggregate supply and the production possibilities curve are analogous. This is because full employment of resources and both productive and allocative efficiency are necessary to get the maximum amount of production possible.







Hey Michelle! I have to say... your blog is very well organized! I can clearly find what I want to find in this post! I do want to add some information that you can put into it.
ReplyDeleteDisposable income is income after taxes or net income. The formula: Gross income - Taxes = Disposable income. With DI, households can either consume or save.
Hi Michelle! Great job on your blog so far, it is very organized and easy to follow along! I would just like to add on to why long run aggregate supply and the production possibilities curve are analogous. This is because full employment of resources and both productive and allocative efficiency are necessary
ReplyDeleteto get the maximum amount of production possible.
The videos are really helpful, and nice blog design!
ReplyDelete