- Balance of payments
- Measure of money inflows and outflows between the United States and the Rest of the World (ROW)
- Inflows are referred to as CREDITS
- Outflows are referred to as DEBITS
- The Balance of Payments is divided into three accounts
- Current Account
- Capital/Financial Account
- Official Reserves
- Double Entry Bookkeeping
- Every transaction in the balance of payments is recorded twice in accordance with standard accounting practice
- Ex: U.S. manufacturer, John Deere, exports $50 million worth of farm equipment to Ireland
- A credit of $50 million to the current account (-$50 million worth of farm equipment or physical assets
- A debit of $50 million to the capital/financial account (+$50 million worth of Euros or financial assets)
- Notice that the two transactions offset each other. Theoretically, the balance payments should always equal zero… Theoretically
- Current Account
- Balance of Trade or Net Exports
- Exports of goods/services (inflow)
- Import of goods/services (outflow)
- Exports create a credit to the balance of payments
- Imports create a debit to the balance of payments
- Net Foreign Income
- Income earned by U.S. owned foreign assets – Income paid to foreign held U.S. assets
- Ex. Interest payments on U.S. owned Brazilian bonds – Interest payments on German owned U.S. Treasury bonds
- Net Transfers (tend to be unilateral)
- Foreign Aid → a debit to the current account
- Ex. Mexican migrant workers send money to family in Mexico
- Capital/Financial Account
- The balance of capital ownership
- Includes the purchase of both real and financial assets
- Direct investment in the United States is a credit to the capital account
- Ex. The Toyota Factory in San Antonio
- Direct investment by US. firms/individuals in a foreign country are debits to the capital account
- Ex. The Intel Factory in San Jose, Costa Rica
- Purchase of foreign financial assets represents a debit to the capital account
- Ex. Warren Buffet buys stock in Petrochina
- Purchase of domestic financial assets by foreigners represents a credit to the capital account
- The United Arab Emirates sovereign wealth fund purchases a large stake in the NASDAQ
- What causes capital/financial flows?
- Differences in rates of return on investment
- Ceteris Paribus, savings will flow toward higher returnRelationship Between Current and Capital Account
- Remember Double entry bookkeeping?
- The current account and the capital account should zero each other out
- That is… if the current account has a negative balance (deficit), then the capital account should then have a positive balance (surplus)
- Official Reserves
- The foreign currency holdings of the United States Federal Reserve System
- When there is a balance of payments surplus, the Fed accumulates foreign currency and debits the balance of payments
- When there is a balance of payments deficit, the Fed depletes its reserves of foreign currency and credits the balance of payments
- The official reserves zero out the balance of payments
- Credits vs. Debits
- Credits - additions to a nation's account
- Debits - subtractions to a nation's account
- How to Calculate the Following
- Typically...
- Balance on trade:
- Merchandise & service exports minus merchandise & service imports
- If have both, then goods exports minus goods imports
- Trade deficit occurs when the balance on trade is negative (imports > exports)
- Trade surplus occurs when the balance on trade is positive (exports > imports)
- Balance on Current Account
- Balance on trade (exports & imports) + Net investment income + Transfer payments
- Official Reserves
- Nationally: Change in CA + Change in FA + Change in Official Reserves = 0
- Foreign Exchange (Forex)
- The buying and selling of currency
- Ex. In order to purchase souvenirs in France, it is first necessary for Americans to sell (supply) their dollars and buy (demand) Euros
- The exchange rate (e) is determined in the foreign currency markets
- Ex. The current exchange rate is approximately 77 Japanese Yen to 1 U.S. Dollar
- Simply put, the exchange rate is the price of a currency
- Do not try to calculate the exact exchange rate
- Ex. We demand (tourist places) Cancun from Mexico
- Changes in Exchange Rates
- Exchange rates (e) are a function of the supply and demand for currency
- An increase in the supply of a currency will decrease the exchange rate of a currency
- A decrease in supply of a currency will increase the exchange rate of a currency
- An increase in demand for a currency will increase the exchange rate of a currency
- A decrease in demand for a currency will decrease the exchange rate of a currency
- Appreciation and Depreciation
- Appreciation of a currency occurs when the exchange rate of that currency increases
- Depreciation of a currency occurs when the exchange rate of that currency decreases
- Ex. If German tourists flock to America to go shopping, then the supply of Euros will increase and the demand for dollars will increase. This will cause the Euro to depreciate and the dollar to appreciate
- Exchange Rate Determinants
- Consumer Tastes
- Ex. A preference for Japanese goods creates an increase in the supply of dollars in the currency exchange market which leads to depreciation of the dollar and an appreciation of Yen
- Relative Income
- Ex. If Mexico's economy is strong and the U.S. economy is in recession, then Mexicans will buy more American goods, increasing the demand for the dollar, causing the dollar to appreciate and the Peso to depreciate
- Relative Price Level
- Ex. If the price level is higher in Canada than in the U.S., then American goods are relatively cheaper than Canadian goods, thus Canadians will import more American goods causing the U.S. dollar to appreciate
- Speculation
- Demand $ - exports and capital inflows
- When the U.S. exports goods/services to other countries, they need OUR dollar to complete the transaction. So they demand OUR money, first they need to SUPPLY theirs.
- Supply $ - imports and capital outflows
- When we import goods/services from other countries, we need THEIR money to complete the transaction. So we demand THEIR money, we need to SUPPLY ours.
- Tips
- Always change the D line on one currency graph, the S line on the other currency's graph
- Move the lines of the two currency graphs in the same direction (right or left) and you will have the correct answer
- If D on one graph increases, S on the other will also increase
- If D moves to the left, S will move to the left on the other graph
- Flexible/Floating Exchange Rate
- Set by market forces with little or no government intervention
- Fixed Exchange Rate - determined by government policies
- Absolute Advantage v. Comparative Advantage
- Absolute Advantage
- Faster, more, more efficient
- Comparative Advantage
- Lower opportunity cost
- The same country can have an absolute advantage in two products

Friday, May 17, 2013
Unit VII

Monday, April 29, 2013
Unit V & VI: AD/AS From Short Run to Long Run
- When changes occur in the short run they results in either increased or decreased producer profits – not changes in wages paid
- In the long run increases in AD result in a higher price level, as in the short run, but as workers demand more money the AS curve shifts left to equate production at the original output level, but now at a higher price
- In the long run, the AS curve is vertical at the natural rate of unemployment (NRU), or full employment (FE) level of output. Everyone who wants a join then has one and no one is enticed into or out of the market
- Demand-Pull inflation will result when an increase in demand shifts the AD curve to the right temporarily increasing output while raising prices
- Cost-Push inflation results when an increase in input costs that shifts the AS curve to the left. In this case the price level increase is not in response to the increase in AD, but instead the cause of the price level increasing
- AS curve doesn’t shift in response to changes in the AD curve in the short run
- i.e. Nominal wages do not respond to price level changes
- Workers may not realize importance of the changes or may be under a contract
- Long Run – period in which nominal wages are fully responsive to price changes in price level
- Philips Curve
- Relationship between the unemployment and inflation
- Trade off between inflation and unemployment only occurs in the short run
- Each point on the Philips curve corresponds to a different level of output
- Long Run Phillips Curve (LRPC)
- It occurs at the natural rate of unemployment
- Represented by a vertical line
- There is no trade off unemployment and inflation in the long run
- The economy produces at the full employment output level
- The nominal wages of workers fully incorporate any change in price level as wages adjust to inflation over the long-run
- LRPC only shifts if LRAS shifts
- Increases in NRU will shift LRPC right
- Decreases in NRU will shift LRPC left
- If the NRU changes, causes LRPC to shift
- Three Types of Unemployment That Change NRU are:
- Frictional
- Structural
- Seasonal
- Short Run Phillips Curve (SRPC)
- PC is assumed to be stable in the short run, because the SRAS curve is assumed to be stable
- Increase in AD = up/left movement along SRPC
- Decrease in AD = down/right movement alon SRPC
- Supply Shock - rapid and significant increases in resource cost which causes the SRAS to shift thus producing a corresponding shift in the SRPC curve
- ex: price of oil
- Misery Index - a combination of inflation and unemployment in any given year
- Single digit misery is good
- Stagflation - when you have high unemployment and high inflation occurring at the same time
- Disinflation - when inflation decreases over time
- Supply-Side Economics/Reaganomics - they support policies that promote GDP growth by arguing that high marginal tax rates along with the current system of transferred payments such as unemployment and social security payments provide disincentives to work, invest, innovate, and undertake entrepreneurial ventures
- The supply-side economists tend to believe that AS curve shifts to the right thus creating the trickle down effect (rich to poor)
- Marginal Tax Rates - the amount paid on last dollar earned or on each additional dollar earned
- By reducing the marginal tax rate, supply-siders believe that you will encourage more people to work longer foregoing leisure for extra income
- Laffer Curve - tradeoffs between tax rates and tax revenues
- The higher the tax rate you set, less money you will collect
- Laffer curve is controversial and debatable

- Three Criticisms of the Laffer Curve
- Where the economy is actually located on the curve is difficult to determine
- Tax cuts also increase demand which can fuel inflation
- Empirical evidence suggests that the impact of tax rates on incentives to work, invest, and save are small

Friday, April 12, 2013
UNIT IV: The Components and Uses of Money
- Uses of Money
- Medium of exchange - bartering/trading
- Unit of account - establishes economic worth
- Store of value - money holds value over a period of time
- Types of Money
- Fiat money - money because the government says so
- Commodity money - goods; gets its value from the type of material from which it is made
- Representative money - IOU; paper money that is backed by something tangible
- Characteristics of Money
- Durability - even if you wash money, it doesn't disintegrate; money is durable
- Portability - you can take it in bill or coin form; money is very portable
- Divisibility - you can divide money
- Uniformity - no matter where you go in U.S., our money is the same
- Scarcity - 2 dollar bill, Susan B. Anthony coin
- Acceptability - our money is accepted anywhere, even though value may be different
- Money Supply
- M1 money - consists of currency (coins and paper money) in circulation, checkable deposits (demand deposits, checks), and traveler's checks
- M2 money - consists of M1 money plus savings accounts plus money market accounts plus deposits held by banks outside the U.S.
- Fractional Reserve Banking - the process by banks of holding a small portion of their deposits in reserves and loaning out the excess
- Banks keep cash on hand (required reserves) to meet depositor's needs
- Banks must keep reserved deposits in their vaults or at the Federal Reserve Bank
- Total reserves (total funds held by a bank) = required reserves + excess reserves
- TR = RR +ER
- excess reserves: reserves beyond those that are required
- Banks can legally lend only to the extent of their excess reserves
- Reserve ratio that is different from required reserves
- Reserve ratio = 1/RR
- Significance of a Fractional Reserve System
- Banks can create money buy lending more than their reserves
- Required reserves do not prevent bank panics, because banks must keep their required reserves
- FDIC is how they insure your money
- Reserved requirement gives the FED control over how much money banks can create
- Functions of the FED (Federal Reserve Bank)
- To control the money supply through monetary policy (circulation of currency and adjusting the interest rate)
- To issue paper money
- To serve as a clearing house for checks
- Regulate banking activities
- Serve as a ban for banks
- Balance Sheet: a statement of assets and claims summarizing the financial position of a firm or bank at some point in time
- Must balance at all times
- Assets
- What you own
- Must be equal to liabilities plus owner's equity/net worth
- Liabilities and Owner's Equity
- What you owe
- Claims of non-owners
- How Banks Work
- Assets
- Reserves
- Required reserves (rr) - %
- Required by FED to keep on hand to meet a demand
- Excess Reserves (er) - %
- Reserves over and above the amount needed to satisfy the minimum reserve ratio set by FED
- Loans to firms, consumers, and other banks (earns interest)
- Loans to government = treasury securities
- Bank property - if bank fails, you could liquidate the building (property)
- Liabilities
- Demand deposits (money put into the bank)
- Timed Deposits (CD's)
- Loans from: Federal Reserve and other banks
- Shareholders Equity - to set up a bank, you must invest your own money in it to have a stake in the banks success or failure
- Reserve Requirement
- Typically the required reserve ratio = 10%
- It is set by the FED
- The FED requires bank to always have some money readily available to meet consumers' demand for cash
- The required reserve ratio is the % of demand deposits (checking account balances) that must not be loaned out
- In a fractional reserve banking system, banks create money
- For a better understanding of fractional reserve banking, I recommend you to take your time out and watch this video:
- The Required Reserve Ratio
- The % of demand deposits that must be stored as vault cash or kept on reserve as federal funds in the bank's account with the Federal Reserve
- The required reserve ratio determines the money multiplier (1/reserve ratio)
- Decreasing the reserve ratio increases the rate of money creation in the banking system and is expansionary
- Increasing the reserve ratio decreases the rate of money creation in the banking system and is contractionary
- Changing the required reserve ratio is the least used tool of monetary policy and is usually held constant at 10%
- The Money Multiplier
- The money multiplier shows us the impact of a change in demand deposits on loans and eventually the money supply
- The money multiplier indicates the total number of dollars created in the banking system by each $1 addition to the monetary base (bank reserves and currency in circulation)
- To calculate the money multiplier, divide 1 by the required reserve ratio
- The Three Types of Multiple Deposit Expansion Questions
- Type 1: Calculate the initial change in excess reserves
- Aka the amount a single bank can loan from the initial deposit
- Type 2: Calculate the change in loans in the banking system
- Type 3: Calculate the change in the money supply
- Sometimes Type 2 and Type 3 will have the same result (i.e. no FED involvement)
- Type 4: Calculate the change in demand deposits
- Max change in loans = initial change in ER x the money multiplier
- Max change in loans + $ amount of FED reserve action = max change in the money supply
- Change in loans = money multiplier x initial change in ER
- Max change in DD = max change in loans + $ amount of initial deposit
- REVIEW
- Required reserves = amount of deposit x required reserve ratio
- Excess reserves = total reserves - required reserves
- Maximum amount a single bank can loan = the change in excess reserves caused by a deposit
- The money multiplier = 1/required reserve ratio
- Total change in loans = amount single bank can lend x money multiplier
- Total change in the money supply = total change in loans + $ amount of FED action
- Total change in demand deposits = total change in loans + any cash deposited
- Fiscal Policy
- Congress
- Tax or Spend
- Monetary Policy
- FED
- Open Market Operations (OMO)
- Reserve Requirement
- Discount Rate
- Federal Funds Rate
- OMO - it is a preferred monetary tool because it is flexible
- The FED can buy or sell bonds
- Discount Rate - the interest rate charged by the FED for overnight loans to commercial banks
- It doesn't change money supply directly
- Federal Fund Rate - the interest rate charged by one commercial bank for overnight loans to another commercial bank
- The rates are negotiated between banks themselves
- The FED has several tools to manage the money supply by manipulating the excess reserves held by banks, a practice known as monetary policy
- Monetary Policy
- Expansionary ("easy" money): increase the money supply
- OMO - buy back bonds from the public
- Required Reserves - decrease reserve ratio
- Discount Rate - decrease discount rate
- Federal Fund Rate - decrease federal fund rate
- Contractionary ("tight" money): decrease the money supply
- OMO - sell bonds to the public
- Required Reserves - increase reserve ratio
- Discount Rate - increase discount rate
- Federal Fund Rate - increase federal fund rate
- Loanable Funds Market
- The market where savers and borrowers exchange funds (QLF) at the real rate of interest (r%)
- The demand for loanable funds, or borrowing comes from households, firms, government and the foreign sector. The demand for loanable funds is in fact the supply of bonds
- The supply of loanable funds, or savings, comes from households, firms, government, and the foreign sector. The supply of loanable funds is also the demand for bonds
- Loanable Funds Market in Equilibrium
- Changes in the Demand for Loanable Funds
- Remember that demand for loanable funds = borrowing (i.e. supplying bonds)
- More borrowing = more demand for loanable funds (increase)
- Less borrowing = less demand for loanable funds (decrease)
- Examples
- Government deficit spending = more borrowing = more demand for loanable funds so DLF increase, r% increase
- Less investment demand = less borrowing = less demand for loanable funds so DLF decrease, r% decrease
- Example of Increase graph for DLF

- Changes in the Supply of Loanable Funds
- Remember that supply of loanable funds = saving (i.e. demand for bonds)
- More saving = more supply of loanable funds (increase)
- Less saving = less supply of loanable funds (decrease)
- Examples
- Government budget surplus = more saving = more supply of loanable funds so SLF increase, r% decrease
- Decrease in consumer's MPS = less saving = less supply of loanable funds so SLF decrease, r% increase
- Example of Decrease Graph for SLF
- Prime Rate - the interest rate that banks charge their most creditworthy customers


Monday, February 25, 2013
Unit III: National Income & Price Determination
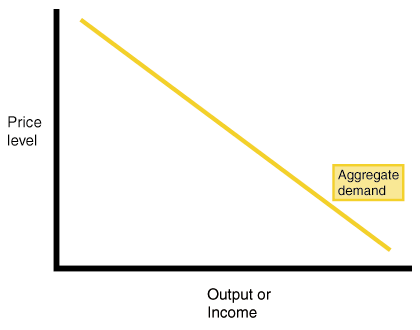
- Aggregate Demand (AD)
- Shows the amount of Real GDP that the private, public, and foreign sector collectively desire to purchase
- The relationship between the price level and the level of Real GDP is inverse
- Aggregate Demand Curve
- Three Reasons AD is downward sloping
- Real-Balances Effect:
- When the price level is high, households and businesses cannot afford to purchase as much output
- When the price level is low, households and businesses can afford to purchase more output
- Interest-Rate Effect:
- A higher price level increases the interest rate which tends to discourage investment
- A lower price level decreases the interest rate which tends to encourage investment
- Foreign Purchases Effect
- A higher price level increases the demand for relatively cheaper imports
- A lower price level increases the foreign demand for relatively cheaper U.S. exports
- Shifts in Aggregate Demand (AD)
- There are two parts to a shift in AD:
- A change in C, Ig, G, and/or Xn
- A multiplier effect that produces a greater change than the original change in the 4 components
- Increases in AD = AD →
- Decreases in AD = AD ←
- Consumption
- Household spending is affected by:
- Consumer wealth
- More wealth = more spending (AD shifts →)
- Less wealth = less spending (AD shifts ←)
- Consumer expectations
- Positive expectations = more spending (AD shifts →)
- Negative expectations = less spending (AD shifts ←)
- Household Indebtedness
- Less debt = more spending (AD shifts →)
- More debt = less spending (AD shifts ←)
- Taxes
- Less taxes = more spending (AD shifts →)
- More taxes = less spending (AD shifts ←)
- Gross Private Investment
- Investment spending is sensitive to:
- The Real Interest Rate
- Lower Real Interest Rate = more investment (AD →)
- Higher Real Interest Rate = less investment (AD ←)
- Expected Returns
- Higher Expected Returns = more investment (AD →)
- Lower Expected Returns = less investment (AD ←)
- Expected Returns are influenced by
- Expectations of future profitability
- Technology
- Degree of Excess Capacity (Existing Stock of Capital)
- Business Taxes
- Government Spending
- More government spending (AD →)
- Less government spending (AD ←)
- Net Exports
- Net Exports are sensitive to:
- Exchange Rates (International value of $)
- Strong $ = more imports and fewer exports (AD ←)
- Weak $ = fewer imports and more exports (AD →)
- Relative Income
- Strong Foreign Economies = more exports (AD →)
- Weak Foreign Economies = less exports (AD ←)
- Aggregate Supply
- The level of Real GDP (GDPR) that firms will produce at each Price Level (PL)
- Long-Run v. Short-Run
- Long-Run
- Period of time where input prices are completely flexible and adjust to changes in the price level
- In the long-run, the level of Real GDP supplied is independent of the price level
- Short-Run
- Period of time where input prices are sticky and do not adjust to changes in the price level
- In the short-run, the level of Real GDP supplied is directly related to the price level
- The Long-Run Aggregate Supply (LRAS)
- The Long-Run Aggregate Supply or LRAS marks the level of full employment in the economy (analogous to PPC)
- LRAS is vertical at the economy's level of full employment
- Changes in SRAS
- An increase in SRAS is seen as a shift to the right. SRAS →
- A decrease in SRAS is seen as a shift to the left. SRAS ←
- The key to understanding shifts in SRAS is per unit cost of production
- Per-unit production cost = total inpurt cost / total output
- Determinants of SRAS (all of the following affect unit production cost)
- Input Prices
- Productivity
- Legal-Institutional Environment
- Input Prices
- Increases in Resource Prices = SRAS ←
- Decreases in Resource Prices = SRAS →
- Productivity
- Productivity = total output / total inputs
- More productivity = lower unit production cost = SRAS →
- Lower productivity = higher unit production cost = SRAS ←
- Legal-Institutional Environment
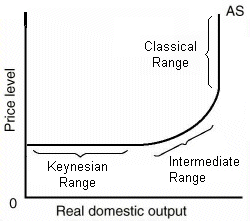
- Ranges/Shapes/Views of A.S.
- The followers of the Keynesian view believe in a horizontal AS curve, because when the economy is below full employment, AD shifts outward.
- Whenever that happens, increase in Real GDP
- Employment drops, but price level is constant
- That means that demand creates its own supply
- Classical Range (Vertical)
- In the long run, the AS curve is vertical, because the only effects of an increase in AD is when we're already at full employment
- Thus, you have an increase in the price level, and supply creates its own demand (Say's Law)
- Intermediate Range
- AS is between the Classical and the Keynesian range
- When this occurs, as AS shifts outward, price level and Real GDP increases
- CLASSICAL vs. KEYNESIAN DEBATE


- The AS/AD Model
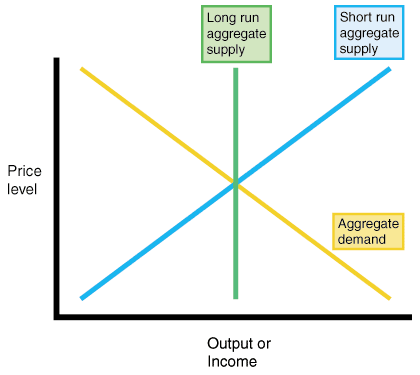
- The equilibrium of AS and AD determines current output (GDPR) and the price level (PL)
- Full Employment
- Full Employment Equilibrium exists where AD intersects SRAS and LRAS at the same point

- Recessionary Gap
- A recessionary gap exists when equilibrium occurs below full employment output

- Inflationary Gap
- An inflationary gap exists when equilibrium occurs beyond full employment output

- Changes (Δ) in AD
- Δ Consumption (C)
- C up, AD right, GDPR up, PL up, u% down, π% up
- C down, AD left, GDPR down, PL down, u% up, π% down
- Δ Gross Private Investment (Ig)
- Ig up, AD right, GDPR up, PL up, u% down, π% up
- Ig down, AD left, GDPR down, PL down, u% up, π% down
- Δ Government Spending (G)
- G up, AD right, GDPR up, PL up, u% down, π% up
- G down, AD left, GDPR down, PL down, u% up, π% down
- Δ Net Exports (Xn)
- Xn up, AD right, GDPR up, PL up, u% down, π% up
- Xn down, AD left, GDPR down, PL down, u% up, π% down
- Increase in AD
- Decrease in AD
- Changes (Δ) in SRAS
- Δ Input Prices
- Input Prices down, SRAS right, GDPR up & PL down, u% down & π% down
- Input Pries up, SRAS left, GDPR down & PL up, u% up & π% up
- Δ Productivity
- Productivity up, SRAS right, GDPR up & PL down, u% down & π% down
- Productivity down, SRAS left, GDPR down & PL up, u% up & π% up
- Δ Legal-Institutional Environment
- Deregulation, SRAS right, GDPR up & PL down, u% down & π% down
- Regulation, SRAS left, GDPR down & PL up, u% up & π% up
- Increase in SRAS
- Decrease in SRAS
- Long-Run Aggregate Supply
- Measuring potential output
- We're assessing if all our resources are used efficiently

- Shifts in LRAS
- Technology
- Economic Growth
- Capital
- Entrepreneurship
- More resources available
- What is investment?
- Money spent or expenditures on:
- New plants (factories)
- Capital equipment (machinery)
- Technology (hardware & software)
- New homes
- Inventories (goods sold by producers)
- Expected Rates of Return
- How does business make investment decisions?
- Cost/Benefit Analysis
- How does business determine the benefits?
- Expected rate of return
- How does business count the cost?
- Interest costs
- How does business determine the amount of investment they under take?
- Compare expected rate of return to interest cost
- If expected return > interest cost, then invest
- If expected return < interest cost, then do not invest
- Real (r%) v. Nominal (i%)
- What's the difference?
- Nominal is the observable rate of interest. Real subtracts out inflation (π%) and is only known ex post facto
- How do you compute the real interest rate (r%)?
- r% = i% - π%
- What then, determines the cost of an investment decision?
- The real interest rate (r%)
- Investment Demand Curve (ID)
- What is the shape of the Investment Demand Curve?
- Downward sloping
- Why?
- When interest rates are high, fewer investments are profitable; when interest rates are low, more investments are profitable
- Conversely, there are few investments that yield high rates of return, and many that yield low rates of return.
- The Investment Demand Curve
- Changes in r% cause changes in Ig. Factors other than r% may shift the entire ID curve.
- Shifts in Investment Demand (ID)
- Cost of Production
- Business Taxes
- Technological Change
- Stock of Capital
- Expectations
- Consumption & Saving / Disposable Income (DI)
- Income after taxes or net income
- 2 Choices
- With disposable income, households can either
- Consume (spend money on goods and services)
- Save (not spend money on goods and services)
- Consumption
- Household spending
- The ability to consume is constrained by
- The amount of disposable income
- The propensity to save
- Do households consume if DI = 0?
- Autonomous consumption
- Dissaving
- Saving
- Household NOT spending
- The ability to save is constrained by
- The amount of disposable income
- The propensity to consume
- Do households save if DI = 0?
- No
- APC & APS
- APS = average propensity to save
- APC = average propensity to consume
- APC + APS = 1
- 1 - APC = APCS
- 1 - APS = APC
- APC > 1 : Dissaving
- -APS : Dissaving
- MPC & MPS
- Marginal propensity to consume
- Δ in C / Δ in DI
- % of every extra dollar earned that is spent
- Marginal propensity to save
- Δ in S / Δ in DI
- % of every dollar earned that is saved
- MPC + MPS = 1
- 1 - MPC = MPS
- 1 - MPS = MPC
- Determinants of C & S
- Wealth
- Expectations
- Household Debt
- Taxes
- MPC
- The fraction of any change in DI that is consumed
- MPS
- The fraction of any change in DI that is saved
- The Spending Multiplier Effect
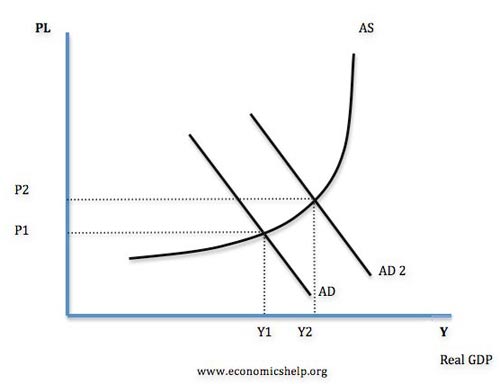
- An initial change in spending (C, Ig, G, Xn) causes a larger change in aggregate spending, or Aggregate Demand (AD)
- Multiplier = Δ in AD / Δ in Spending
- Why does this happen?
- Expenditures and income flow continuously which sets off a spending increase in the economy.
- Calculating the Spending Multiplier
- The spending multiplier can be calculated from the MPC or the MPS.
- Multiplier = 1/1-MPC or 1/MPS
- Multipliers are (+) when there is an increase in spending and (-) when there is a decrease
- Calculating the Tax Multiplier
- When the government taxes, the multiplier works in reverse
- Why?
- Because now money is leaving the circular flow
- Tax Multiplier (note: it's negative)
- = -MPC/1-MPC or -MPC/MPS
- If there is a tax-CUT, then the multiplier is (+), because there is now more money in the circular flow
- MPS, MPC, & Multipliers
- Step 1: Calculate the MPC and MPS
- Step 2: Determine which multiplier to use, and whether it's (+) or (-)
- Step 3: Calculate the spending and/or tax multiplier
- Step 4: Calculate the change in AD
- For a better understanding of calculating the MPC, MPS, and the multiplier, I recommend you to watch this video:



- Fiscal Policy
- Expansionary and Contractionary policy
- Deficits and Surpluses
- Built-in Stability
- Changes in the expenditures or tax revenues of the federal government
- 2 tools of fiscal policy:
- Taxes - government can increase or decrease taxes
- Spending - government can increase or decrease spending
- Fiscal policy is enacted to promote our nation's economic goals: full employment, price stability, economic growth
- Deficits, Surpluses, and Debt
- Balanced Budget
- Revenues = Expenditures
- Budget Deficit
- Revenues < Expenditures
- Budget Surplus
- Revenues > Expenditures
- Government Debt
- Sum of all deficits - Sum of all surpluses
- Government must borrow money when it runs a budget deficit
- Government borrows from
- Individuals
- Corporations
- Financial institutions
- Foreign entities or foreign governments
- Fiscal Policy Two Options
- Discretionary Fiscal Policy (action)
- Expansionary fiscal policy - think deficit (when in a recession)
- Contractionary fiscal policy - think surplus (going through an inflationary period)
- Non-Discretionary Fiscal Policy (no action)
- Discretionary v. Automatic Fiscal Policies
- Discretionary
- Increasing or Decreasing Government Spending and/or Taxes in order to return the economy to full employment. Discretionary policy involves policy makers doing fiscal policy in response to an economic problem.
- Automatic
- Unemployment compensation and marginal tax rates are examples of automatic policies that help mitigate the effects of recession and inflation. Automatic fiscal policy takes place without policy makers having to respond to current economic problems.
- Contractionary v. Expansionary Fiscal Policy
- Contractionary fiscal policy - policy designed to decrease aggregate demand
- Strategy for controlling inflation
- Expansionary fiscal policy - policy designed to increase aggregate demand
- Strategy for increasing GDP, combatting a recession, and reducing unemployment
- Expansionary Fiscal Policy
- Recession is countered with expansionary policy
- Increase government spending
- Decrease taxes
- If recession, then increased government spending, and AD shifts right
- Contractionary Fiscal Policy
- Inflation is countered with contractionary policy
- Decrease government spending
- Increase taxes
- Progressive Tax System
- Average tax rate (tax - revenue/GDP) rises with GDP
- Proportional Tax System
- Average tax rate remains constant as GDP changes
- Regressive Tax System
- Average tax rate falls with GDP
- The more progressive the tax system, the greater the economy's built-in stability.
Saturday, February 9, 2013
Unit II
- Types of Economic Systems:
- Command:
- Also known as centrally planned
- The government decides questions of production
- The government owns land and capital
- The government controls labor
- Ex: Cuba
- Traditional:
- Based on rituals, habits, and customs
- Most decisions are made by the elders
- Ex: Indian tribes, African tribes
- Free Market:
- People and firms act in their own best interest
- Allows buyers and sellers to exchange goods and services
- Only one true free market in the world: Hong Kong
- Mixed:
- Have government regulating businesses to protect the public's interest
- Ex: U.S., Canada, Mexico
- Three Economic Questions that every society must answer:
- What goods and services should be produced?
- How will these goods and services be produced?
- Who will consume these goods and services?
- Market: an institution or mechanism allowing buyers and sellers to make trades
- Product Market: the buyer is usually a consumer, and the seller is a firm
- Factor Market (Resource Market): you have your factors of production
- Most important factor is labor
- The buyer is usually the firm, the seller is the factor owner
- Firms/Businesses demanding resources - Factor Market (Think "CELL")
- CIRCULAR FLOW

- Household: a person or a group of people that share their income
- Firms: organization that produces goods and services for sell
- Gross Domestic Product (GDP): total value of all final goods and services produced within a country's borders within a given year
- GDP includes all production or income earned within the U.S. by U.S. and foreign producers
- It excludes production outside of the U.S. even by Americans
- Gross National Product (GNP): it is the total value of all final goods and services produced by Americans in a year
- It includes production or income earned by Americans anywhere in the world
- It excludes production by non-Americans even in the U.S.
- GNP = GDP + Net foreign factor payment
- Formula to Calculate GDP
- C + Ig + G + Xn
- C = Personal Consumption (67%)
- Purchases of finished goods and services
- Ig = Gross Private Domestic Investment
- Factory equipment maintenance, new factory equipment, construction of houses, unsold inventory of products built in a year
- G = Government Purchases of Goods and Services
- School buses, medicine, aircraft
- Xn = Net Exports (Exports - Imports)
- Gross Private Domestic Investment = Net private domestic investment + Depreciation
- EXAMPLES


- What's Included in GDP:
- Final goods and services
- Income earned (wages, rents, interest, profits)
- Interest payments or corporate bonds
- Current production of final goods
- Unsold output (business inventories)
- What's Excluded in GDP:
- Used goods/secondhand
- Gifts or transfers (scholarship, social security worked for)
- Stocks and securities
- Unreported business activities conducted in cash (waiter, waitresses)
- Illegal activities (drugs, black market)
- Financial transactions between banks and businesses
- Intermediate goods (avoid double counting, used in production of final goods)
- House market activities (babysitting)
- Expenditure Approach: income generated from production of goods and services
- Formula: C + Ig + G + Xn
- Income Approach: income generated from the production of final output
- Formula: W + R + I + P + Statistical adjustments
- Net National Product (NNP)
- Formula: GNP - Depreciation
- Net Domestic Product (NDP)
- Formula: GDP - Depreciation
- Depreciation (Consumption of Fixed Capital)
- National Income (NI): income earned by American-owned resources whether here or abroad
- NNP - Indirect Business Taxes (IBT)
- CE + RI + II + CP + PI
- Consumption of employees + rental income + interest income + corporate profits + proprietor's income
- GDP - IBT - Depreciation - Net foreign factor payment
- Disposable Personal Income (DPI): after tax income available for household consumptions
- Formula: NI - household taxes + GTP (government transfer payments)
- Nominal GDP (NGDP): it measures GDP in current dollars regardless of the output
- Formula: price x quantity OR p x q = NGDP
- Real GDP (RGDP): it measures GDP in constant dollars; it is adjusted for inflation, therefore, it reverts to base year prices
- EXAMPLE

For a walkthrough of how to do an example of a Real GDP and Nominal GDP problem, I recommend you to watch this video:
- GDP Deflator: a measure of the level of prices of all new domestically produced final goods and services in an economy
- Formula: nominal GDP/real GDP x 100
- Inflation Rate: a rise in the general level of prices
- [(Price Index in Year 2 - Price Index in Year 1)/Price Index in Year 1] x 100
- Consumer Price Index (CPI): most widely used measure of the overall price level in the U.S.
- (Price of the market basket in the particular year/Price of the same market basket in another year) x 100
- ECONOMIC NORMS (RATES)

- Inflation: a rise in the general price level
- Deflation: a decline in the general price level
- Disinflation: it occurs when the inflation rate declines
- Solving inflation problems:
- Rule of 70: how many years will it take to double inflation
- Formula: 70 divided by inflation rate
- Inflation rate: [(current year price index - prior year price index)/prior year price index] x 100
- Finding real interest rates
- Real Interest Rate: the cost of borrowing or lending money that is adjusted for inflation
- Real interest rate = nominal interest rate - inflation
- Real interest rate is expressed as a percentage (%)
- Nominal Interest Rate: the unadjusted cost of borrowing or lending money
- Causes of Inflation:
- Demand-pull: caused by an excess of demand over output that pulls prices upward
- Sources of Demand-pull:
- Increases in government purchases
- Excessive increases in the money supply which creates a situation of hyperinflation
- Hyperinflation: where you have a rapid rise or extremely high inflation rate
- Rising incomes as the economy approaches full employment output
- (This is what it means): As workers earn more, they increases their demand for goods
- Cost-push (supply side economics): caused by a rise in per unit production cost due to increasing resource cost
- Sources of Cost-push:
- Supply shocks: dramatic rise in energy or raw material prices due to input shortages or a growing demand for inputs
- Price Wage Spiral: workers seek higher wages to offset rising consumer prices
- Effects of Inflation (Anticipated vs. Unanticipated)
- Anticipated: expecting/waiting for inflation to happen
- Unanticipated: you don't know what happens or when it happens
- Unanticipated inflation has stronger effects, because those expecting inflation may be able to adjust their work or spending activities to avoid or lessen the effects
- Wages and pensions may have cost of living adjustments (COLAs) built in to offset anticipated inflation
- Expected inflation increases the nominal costs of borrowing while unexpected inflation reduces the real cost of borrowing
- HURT:
- Fixed income groups: they will be hurt because their real income suffers, because nominal income does not rise with the prices
- grandparents, pension people, social security (they getting COLAs)
- Savers: hurt by unanticipated inflation, because inflation takes away from the interest earned on the account
- Lenders: can be hurt by unanticipated inflation, debts will be repaid with cheaper dollars than those that were locked out
- HELP/GAIN:
- Borrowers: can be helped by unanticipated inflation, debts will be repaid with cheaper dollars than those that were loaned out
- EXAMPLE

- Unemployment: failure to use available resources (labor)
- 3 main groups:
- Employed: includes those that are self-employed
- Unemployed
- New entrants
- Re entrants
- Laid off
- Lost last job (fired)
- Quit last job
- Not in the work/labor force
- Armed forces
- Home makers
- Students
- Retirees
- Disabled people
- Discouraged workers
- Those that are in prison
- Those that are in mental institutions
- Unemployment rate: (# of unemployed/total labor force) x 100
- Total labor force = # of unemployed + # of employed
For an example of a problem in finding the unemployment rate, I recommend you watch this video:
- Standard unemployment rate: 4 to 6%
- Lower than 4% = great
- Higher than 6% = you have an issue
- Four Types of Unemployment:
- Frictional: temporary, transitional, short-term
- Characterized as in between jobs and they're searching for a job
- Graduates, people who get fired or quit their jobs
- It signals that new jobs are available
- Will not work for minimum wage
- Cyclical: caused by the recession phase of the business cycle
- Means there is deficient demand for goods and services
- If you're laid off due to recession, that job will come back (advantage)
- Structural: described as technological or long-term
- Due to (reasons):
- Automation: due to consumer taste, jobs may become obsolete
- Creative Destruction: as new jobs are created, others are lost
- When the new jobs come, your skills are no longer transferrable
- Seasonal: weather-related or seasonal jobs
- Ex: construction jobs, Santa Claus, Easter Bunny, Life Guard, school bus drivers
- EXAMPLE

- Full Employment (FE) = natural rate of unemployment (NRU)
- It is equal to structural and frictional employment
- Full employment does not mean zero unemployment
- Okun's Law: describes how unemployment relates to a nation's GDP
- States that for every 1% unemployment above the NRU, a negative GDP gap of 2% will occur
- Unequal burdens of unemployment:
- Rates are lower for white-collar workers
- Teenagers have the highest rates
- Blacks have higher rates than whites
- Raters for males and females are comparable
Sunday, January 20, 2013
Unit I: Basic Economic Concepts
Before I say anything else, just being introduced to the first unit of economics was more than I had expected. I had heard from other people who had taken this class that it was easier than AP government. In my opinion, I think that both are quite the same, except for the fact that you can't solely memorize the material for economics. You have to find an understanding in the concepts in order to be successful in this course. On the other hand, for government, reading out of a textbook or just memorizing notes would easily get you a decent grade. Now enough of that, I'll tell you all about what I have learned about economics in Unit 1.
Here's the notes that I've taken throughout the whole unit (you can click on each image to maximize it):
- Basic Economic Concepts:


- Production Possibilities Curves:


For a better understanding of the production possibilities frontier, I recommend you to watch this video. At around the time 8:15 is when he goes into detail about the curve:
- Supply and Demand:


- Elasticity of Demand:


Subscribe to:
Posts (Atom)